Financial Health
Financial health involves having adequate financial resources that support day-to-day living and long-term stability. It includes access to steady income, manageable debt, savings, and the resources to cover emergencies, healthcare, housing, education, and basic needs.
Examples: Median household income, % with employer-provided health insurance, % below poverty level, % experiencing housing insecurity.
Financial Health Indicators

SNAP, or the Supplemental Nutrition Assistance Program, provides food assistance to eligible low-income individuals and families through monthly benefits on an Electronic Benefits Transfer (EBT) card, usable at participating stores to buy food. Administered by the USDA‘s Food and Nutrition Service (FNS), SNAP determines eligibility at the state level. Eligibility is based on household income, assets, and family size, with benefits varying accordingly.

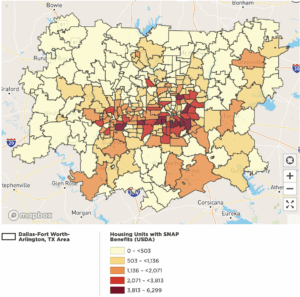
Follow the thumbnail to Housing Units with SNAP Benefits. You can toggle between maps and mouse over regions to view the median household incomes of places (cities), neighborhoods, zip codes and census tracks.
 The Census Bureau uses a set of money income thresholds that vary by family size and composition to determine who is in poverty. If a family’s total income is less than the family’s threshold, then that family and every individual in it is considered in poverty.

Follow the thumbnail to see how families below poverty level with children within DFW households. You can toggle between maps and mouse over regions to view the median household incomes of places (cities), neighborhoods, zip codes and census tracks.
Individuals with high subjective debt—meaning they feel more financially burdened than others—reported an 11.7% increase in perceived stress symptoms and a 13.2% increase in depressive symptoms, compared to the average.
People living in poverty face higher rates of nearly every negative health outcome, from chronic illness to injury to early death. In the most low-resourced U.S. communities, life expectancy is often 10–15 years lower than in the wealthiest neighborhoods. The risk of cardiac arrest is 30–80% higher in neighborhoods with the lowest socioeconomic status compared to the wealthiest areas.

Excessive housing costs often force families to make trade-offs between rent, food, healthcare, and other essential needs. For uninsured residents, this financial burden can significantly reduce access to preventive care and increase the risk of untreated chronic conditions, highlighting the connection between economic stability, housing security, and health outcomes.
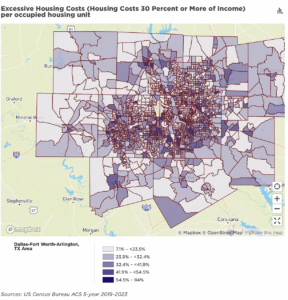
Follow the thumbnail to see the excessive housing cost within DFW households. You can toggle between maps and mouse over regions to view the median household incomes of places (cities), neighborhoods, zip codes and census tracks.

In the U.S., people with low or medium job skills who were unemployed had a 2.4x higher risk of dying than those who were employed.

Follow the thumbnail to see wage of workers – low wage DFW households is distributed through the metropolitan region. You can toggle between maps and mouse over regions to view the median household incomes of places (cities), counties, zip codes and census tracks.
Median Household Income in DFW (1990–2030)

Housing Stability: Housing Costs
Whether renting or owning, when a large portion of a family’s income goes toward housing, there’s less room in the budget for other essential needs. This financial strain can make it difficult to cover groceries, utilities, transportation, or childcare. By working to increase access to affordable, stable housing, our families are more likely to have the foundation they need to thrive.
 Severely cost burdened are those households (owner or renter) whose monthly housing costs (including utilities) exceed 50% of their monthly income. Low income are those households (owner or renter) who earn up to 80% of the US Housing and Urban Development Area Median Family Income (HAMFI). HAMFI “is the median family income calculated by HUD for each jurisdiction, in order to determine Fair Market Rents (FMRs) and income limits for HUD programs. HAMFI will not necessarily be the same as other calculations of median incomes (such as a simple Census number), due to a series of adjustments that are made” (Source: https://www.huduser.gov/portal/datasets/cp/CHAS/bg_chas.html).
People in disorganized homes face a 30% higher risk of depression.
Those experiencing unstable housing—frequent moves, risk of eviction—face a 70% higher risk.
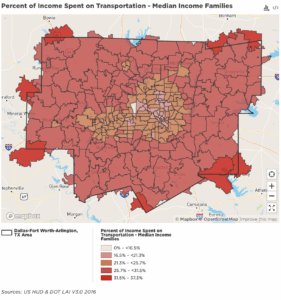
The Location Affordability Index (LAI) uses 8 household profiles to characterize housing and transportation costs. A median income family is defined as a 4 person household with 2 commuters who earn a combined median household income for a given area.
Follow the thumbnail to observe the percentage of income spent on Transportation based on median income families within DFW households. You can toggle between maps and mouse over regions to view the median household incomes of places (cities), neighborhoods, zip codes and census tracks.
 Follow the thumbnail to observe the percentage of people with health insurance within DFW households. You can toggle between maps and mouse over regions to view the median household incomes of places (cities), neighborhoods, zip codes and census tracks.
The Census Bureau “broadly classifies health insurance coverage as private or public. Private health insurance is a plan provided through an employer or union, a plan purchased by an individual from a private company, or TRICARE or other military health care. Public coverage includes the federal programs Medicare, Medicaid, and VA Health Care (provided through the Department of Veterans Affairs); the Children’s Health Insurance Program (CHIP); and local medical programs for indigents (this program is included only for the Pacific Islands). People who had no reported health coverage, or those whose only health coverage was Indian Health service (this program is included only in the American Community Survey), were considered uninsured” (Source: https://www.census.gov/glossary/?term=Health+insurance+coverage).
Being uninsured is linked to a:
• 1.65× higher risk of stroke
• 1.22× higher risk of heart attack (myocardial infarction)
• 1.26× higher risk of dying from cardiovascular disease
Social media