Community
Community is about building supportive, connected environments that empower people to care for one another. When individuals feel a sense of belonging and shared purpose, they are more likely to engage in healthier behaviors, experience lower stress levels, and recover faster from illness.

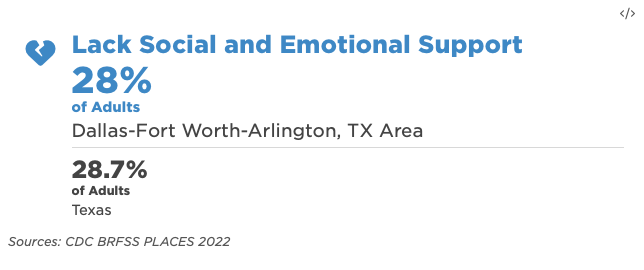
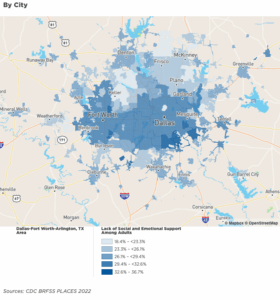
Follow the thumbnail to view lack of social and emotional support with Dallas-Fort Worth Metropolitan. You can toggle between maps and mouse over regions to view lack of social and emotional support of places (cities), neighborhoods, zip codes and census tracks.
People living in low-resourced communities facing systemic barriers are significantly more likely to develop serious health conditions compared to those in more resourced areas:
High blood pressure: 14% more likely
Diabetes: 12% more likely
High cholesterol: 9% more likely
Chronic kidney disease: 17% more likely
Smoking habits: 5% more likely
Heart disease: 15% more likely
While a person can make individual behavior changes to improve their health, they are limited by what they have access to. For example, walking just 30 minutes a day for five days of the week has a plethora of health benefits including the prevention of chronic disease, improved bone and muscle health, weight management, and even increased brain power and improved mental health.
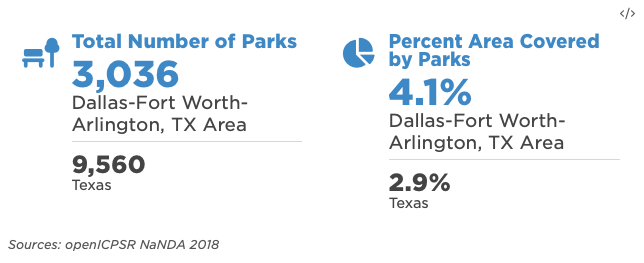

Follow the thumbnail to the numbers of parks with Dallas-Fort Worth Metropolitan. You can toggle between maps and mouse over regions to view the numbers of parks of places (cities), neighborhoods, zip codes and census tracks.
Area Dedicated to Parks

Follow the thumbnail to areas dedicated to parks with Dallas-Fort Worth Metropolitan. You can toggle between maps and mouse over regions to view areas dedicated to parks of places (cities), neighborhoods, zip codes and census tracks.

Areas people had to travel the farthest for healthcare had higher death rates. Counties where the nearest health center was more than 5.5 miles away had about 4% more deaths compared to those with closer access to health car. In some counties, death rates were 7% to 33% higher for people who lived farther from medical care, depending on the area.
Distance From Healthy Food
What Does This Data Mean?
This dataset contains the percent of people living a far distance (i.e, more than 1/2 mile in urban areas and 10 miles in rural areas) from a healthy food source. Low access to healthy food is defined as a significant number of individuals within the geography being far from a supermarket, wholesale club, supercenter, or grocery store.
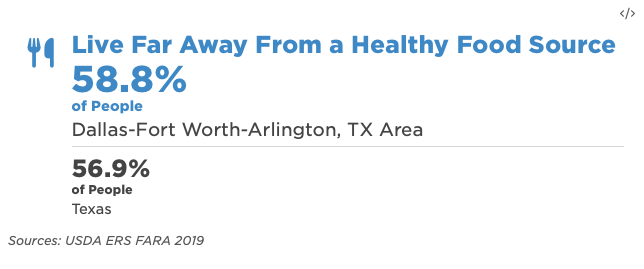
People Who Live Far Away From a Healthy Food Source
Follow the thumbnail to see the percentage of people who live far away from a healthy food source. You can toggle between maps to view the data across places (cities), neighborhoods, zip codes and census tracks.
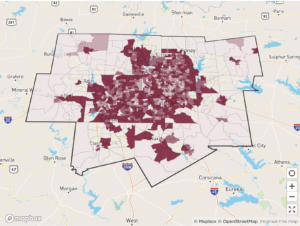
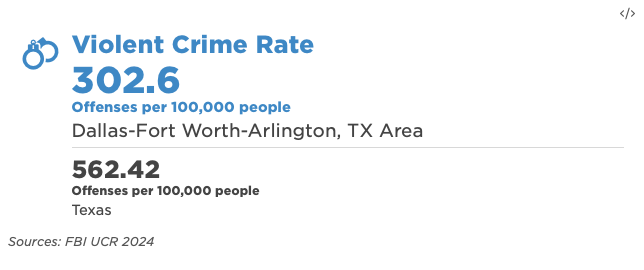
Violent Crimes
Risk Factors for Violence
Violent crimes are defined in the UCR Program as “those offenses that involve force or the threat of force” (Source: https://ucr.fbi.gov/crime-in-the-u.s/2019/crime-in-the-u.s.-2019/topic-pages/violent-crime)
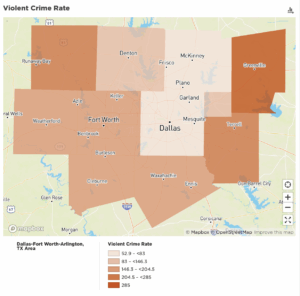
This dataset contains the rate of total violent crime offenses per 100,000 people. Violent crimes consist of the following UCR-defined offenses: murder and nonnegligent manslaughter, rape, robbery, and aggravated assault.
Follow the thumbnail to rate of total violent crime offenses in Dallas-Fort Worth, Texas metropolitan area. You can toggle between maps and mouse over regions to view the total violent crime of places (cities), neighborhoods, zip codes and census tracks.
Walkability
Walkability Indicator
Walkability is a measure used to characterize the ease of pedestrian travel in an area. The index ranges from 1-20, with lower values being less walkable locations and higher values being more walkable.

Follow the thumbnail to the walkability with Dallas-Fort Worth Metropolitan. You can toggle between maps and mouse over regions to view the walkability of places (cities), neighborhoods, zip codes and census tracks.
This dataset shows how easy it is for someone to walk to a transit stop. High values (near 20) mean it is easy to walk to a transit stop. Areas with lower values are areas that require a long walk to a transit stop. Areas without transit data available were given a score of 1.
Social media